View the 2017 Affordability Report as a PDF
2017 Affordability Report
i
Executive Summary
In 2017, the world will mark a significant milestone: 50% global internet penetration. Though internet access has become a daily expectation for many, this will mark the first time that the scales have tipped toward more of the world being connected than not. But for the half of the world that remains offline — mostly women in developing countries — this means being left even further behind as the digital revolution steams ahead.
Last year, the global community recognised the importance of digital equality for socio-economic growth and opportunity and set a target as part of the new Sustainable Development Goals: affordable, universal internet access by 2020. The bad news is that without urgent policy action, we’ll miss this target by over 20 years. High connectivity costs remain one of the biggest obstacles to achieving the universal access pledge. Though broadband prices are coming down, they simply aren’t falling fast enough, leaving low income earners and other marginalised populations unable to afford even a basic connection. Furthermore, our research shows that the pace of policy change has been far too slow:
- Just half of the countries studied have public access policies in place that are also backed by financial support for implementation.
- 45% of countries have plans to facilitate resource sharing among telecommunications companies (e.g., sharing of infrastructure, including towers and fibre networks); even where countries have plans, implementation is rare.
- Only one in three countries have detailed, time-bound plans for making more spectrum available to meet increasing demands.
- Universal Service and Access Funds, an important tool to finance strategic investments in the sector, either don’t exist or are dormant in over a third of countries.
- National broadband plans to guide the policy reforms needed to achieve universal access have never been developed or are badly outdated in 41% of countries.
The good news is that we know what we need to do to turn things around and make the internet affordable for all. Smart policies that encourage more competition and innovation in key areas, such as spectrum, infrastructure, and last-mile connectivity, can help to pave the way toward affordability. These policies should be grounded in a new, more ambitious affordability target of “1 for 2”— 1GB of data for no more than 2% of income — that enables more income groups to afford to connect. Just 19 of the 58 countries assessed for this year’s report have met this “1 for 2” target. For this reason, it is critical that countries also implement public access solutions to ensure that those at the base of the pyramid don’t also remain relegated to the back of the connectivity queue.
More specifically, we recommend that countries take action to do the following:
Employ Public Access Solutions to Close the Digital Divide
Public access solutions — including subsidised access in schools and local centres, public WiFi, and community networks — are critical to reach groups that cannot pay for regular internet use, even once prices have reduced to an affordable level. These programmes offer an untapped opportunity for making a significant dent in internet access and use targets, and should become a key focus for policymakers as they seek to achieve the Sustainable Development Goals.
Foster Market Competition Through Smart Policy
Strong policies to promote healthy competition and protect consumers must be a priority for policymakers. Open and competitive markets provide the foundation for growth, innovation, and affordable access. Yet, antiquated policy frameworks remain in place across many countries, preventing competition from being a force of market change and allowing inefficient providers to dominate and keep prices high. Smart policy that enables the competition needed to drive prices down must be implemented urgently.
Implement Innovative Uses of Spectrum through Transparent Policy
Governments must ensure they have a detailed plan for allocating spectrum sufficient to meet projected increases in demand, with a clear timeline for implementation. Policymakers should also encourage innovative uses of spectrum to advance affordable access, whether by supporting community networks or partnering to develop new technologies.
Take Urgent Action to Promote Infrastructure and Resource Sharing
Sharing is not easy, but with clear policy incentives and regulatory certainty, it provides operators the best option to reduce the cost of service provision, while also maintaining a healthy stream of revenue from market growth. Governments have a critical role in facilitating and incentivising resource sharing among market players.
Make Effective Use of Universal Service and Access Funds
Universal Service and Access Funds (USAFs) — which collect contributions from operators in order to subsidise the expansion of telecommunications and internet in under-served communities — can be a powerful tool if well-managed and transparent. Unfortunately, some USAFs are totally inactive, while others have been poorly run. Governments must consider and implement solutions to these issues, including developing strategies for effective use of funds, timely publication of USAF monitoring and financial reports, and other information in open data formats.
Ensure Effective Broadband Planning Turns Into Effective Implementation
Broadband plans are crucial to integrate and sequence the above reforms. Plans that set clear, time-bound and measurable targets are best of all, as targets provide accountability for translating plans into action.
1
Affordability in 2017: Slow Progress Means Billions Are Still Excluded
In 2017, we will pass a significant threshold: 50% of the world will be online. This milestone will mark the first time the scales have been tipped toward more people connected than not, and speaks to the impressive growth of the internet — just ten years ago, barely over 20% of the world’s population was online. But for the other half of the world that remains offline — mostly women in developing countries — this means being left even further behind as the digital revolution steams ahead.
Today, internet access is not only a catalyst for economic growth, it is also increasingly a precondition for people to participate in government and society. Poor and marginalised populations arguably stand to gain the most. On the other hand, a world in which only the affluent enjoy the benefits of connectivity is a world in which inequality will quickly deepen. For these reasons, among many others, the UN Sustainable Development Goals include a target to achieve universal, affordable internet access for all by 2020 — a goal that we’re on track to miss by over 20 years unless greater efforts are made to get the world online.
Sky-high connectivity costs remain one of the biggest obstacles to achieving the universal access pledge. To buy just 1GB of data in Africa, for example, costs an average citizen nearly 18% of their monthly income. Though broadband prices continue to fall, they simply aren’t dropping fast enough. Meanwhile, high and growing income inequality in many countries conspires to ensure that only the relatively rich can afford a private internet subscription, and public access solutions remain few and far between. A majority of countries are failing to take the action needed to drive prices down and enable access for all.
Figure 1. Average price of a 1GB (prepaid, mobile) broadband plan as a % of GNI per capita, by region (2013-2015)
To turn things around, we first need to base national broadband strategies and ICT plans on a sufficiently ambitious affordability target. For years, internet access has been considered to be ‘affordable’ if 500 megabytes (MB) of data can be bought for less than 5% of average monthly incomes. Yet when we examined this target in detail last year, we discovered some major flaws. First, 500MB is simply too little data to allow for meaningful internet use; today, 1GB is a more realistic minimum monthly allocation. Second, at the 5% benchmark, income inequality bars the majority of people from access in many countries. Far better is a level of 2% or less of average monthly income. Our research has shown that when prices drop to this point, more income groups — often including the bottom 20% — can afford to connect.
For this reason, we’re advocating for a new affordability target of “1 for 2”— 1GB of data for no more than 2% of income. Unfortunately, of the 58 countries covered in this year’s Affordability Report, just 19 have met this “1 for 2” target.
The good news is that it is not hard to improve this and make the internet affordable to all. Smart policies can pave the way for more affordable broadband by encouraging more competition and innovation in key areas, such as spectrum, infrastructure, and last-mile rural connectivity. In parallel, countries can implement public access solutions to ensure that those at the base of the pyramid don’t also remain relegated to the back of the connectivity queue. This report highlights case studies of a number of countries that have successfully pursued policy reforms across these areas in an effort to increase affordability and expand access.
While some progress has been made, our research shows that, overall, the pace of policy change has been far too slow:
- Just 50% of countries have policies to support public access that are also backed by some financial support for implementation, resulting in unfulfilled public access plans.
- Only 45% of countries have developed plans to reduce costs by facilitating resource sharing (e.g., sharing of infrastructure like towers or fibre networks) among telecommunications companies. Effective implementation of such policies is even rarer.
- Only one in three countries has a detailed, time-bound plan for making more spectrum available to meet increasing mobile broadband demands.
- In over a third of countries, Universal Service and Access Funds don’t exist or are dormant.
- National broadband plans — an overarching framework for policy reform to drive universal access — are badly out of date, or have never been developed, in 41% of countries surveyed.
The stakes are too high to continue pushing broadband policy to the side. With deliberate and coordinated action and cooperation among a wider range of players, we can overcome the affordability barrier and achieve the global goal of universal, affordable access for all. But we must move much faster — and we must start today.
2
Measuring Progress Toward Affordability: The Affordability Drivers Index
There are a range of policy and regulatory steps that countries can take to drive down broadband prices and effectively tackle the affordability barrier to access. The Affordability Drivers Index (ADI) assesses the extent to which countries have implemented a number of factors that can lower the overall cost structure for broadband (i.e., affordability drivers).
| ADI Rank | Country | Access Score | Infrastructure Score | ADI Score |
|---|---|---|---|---|
| 1 |  Colombia Colombia |
85.28 | 58.15 | 72.87 |
| 2 |  Mexico Mexico |
87.23 | 53.43 | 71.47 |
| 3 |  Peru Peru |
80.54 | 58.89 | 70.84 |
| 4 |  Malaysia Malaysia |
85.25 | 49.86 | 68.65 |
| 5 |  Costa Rica Costa Rica |
88.36 | 44.3 | 67.4 |
| 6 |  Ecuador Ecuador |
79.48 | 46.1 | 63.81 |
| 7 |  Argentina Argentina |
76.26 | 48.95 | 63.62 |
| 8 |  Mauritius Mauritius |
78.06 | 43.39 | 61.7 |
| 9 |  Turkey Turkey |
71.73 | 48.58 | 61.13 |
| 10 |  Brazil Brazil |
68.57 | 51.05 | 60.78 |
| 11 |  Morocco Morocco |
72.94 | 40.73 | 57.75 |
| 12 |  Jamaica Jamaica |
74.84 | 37.12 | 56.88 |
| 13 |  Nigeria Nigeria |
67.66 | 43.7 | 56.58 |
| 14 |  Dominican Rep. Dominican Rep. |
68.8 | 40.42 | 55.49 |
| 15 |  Botswana Botswana |
67.06 | 41.91 | 55.37 |
| 16 |  Viet Nam Viet Nam |
69.75 | 35.65 | 53.55 |
| 17 |  Thailand Thailand |
67.79 | 37.32 | 53.4 |
| 18 |  Côte d'Ivoire Côte d'Ivoire |
64.97 | 39.84 | 53.25 |
| 19 |  Bolivia Bolivia |
63.74 | 40.25 | 52.83 |
| 20 |  Honduras Honduras |
59.44 | 42.19 | 51.63 |
| 21 |  Rwanda Rwanda |
66.09 | 35.23 | 51.48 |
| 22 |  South Africa South Africa |
61 | 39.78 | 51.2 |
| 23 |  Indonesia Indonesia |
61.34 | 38.89 | 50.92 |
| 24 |  Sri Lanka Sri Lanka |
55.17 | 45.03 | 50.91 |
| 25 |  China China |
63.56 | 36.13 | 50.65 |
| 26 |  Ghana Ghana |
60.68 | 37.75 | 50.01 |
| 27 |  Jordan Jordan |
62.57 | 34.29 | 49.22 |
| 28 |  Pakistan Pakistan |
56.54 | 40.03 | 49.07 |
| 29 |  Benin Benin |
56.87 | 39.47 | 48.95 |
| 30 |  Kenya Kenya |
61.55 | 34.53 | 48.82 |
| 31 |  Namibia Namibia |
61.29 | 33.66 | 48.24 |
| 32 |  Uganda Uganda |
58.57 | 35.77 | 47.93 |
| 33 |  Philippines Philippines |
57.09 | 36.46 | 47.53 |
| 34 |  Tunisia Tunisia |
56.58 | 36.37 | 47.23 |
| 35 |  India India |
55.36 | 37.46 | 47.16 |
| 36 |  Egypt Egypt |
52.78 | 35.93 | 45.07 |
| 37 |  Zambia Zambia |
57.06 | 31.41 | 44.95 |
| 38 |  Gambia Gambia |
53.07 | 35.38 | 44.94 |
| 39 |  United Republic Of Tanzania United Republic Of Tanzania |
53.43 | 32.64 | 43.73 |
| 40 |  Venezuela (Bolivarian Republic Of) Venezuela (Bolivarian Republic Of) |
55.35 | 27.05 | 41.86 |
| 41 |  Nepal Nepal |
51.8 | 30.35 | 41.74 |
| 42 |  Myanmar Myanmar |
40.61 | 40.83 | 41.37 |
| 43 |  Kazakhstan Kazakhstan |
58.86 | 21.97 | 41.07 |
| 44 |  Mali Mali |
49.25 | 31.07 | 40.81 |
| 45 |  Mozambique Mozambique |
47.47 | 31.58 | 40.16 |
| 46 |  Bangladesh Bangladesh |
45.69 | 31.88 | 39.41 |
| 47 |  Senegal Senegal |
49.63 | 27.26 | 39.07 |
| 48 |  Cambodia Cambodia |
42.17 | 32.72 | 38.05 |
| 49 |  Nicaragua Nicaragua |
48.17 | 24.86 | 37.1 |
| 50 |  Zimbabwe Zimbabwe |
47.26 | 21.56 | 34.97 |
| 51 |  Malawi Malawi |
40.07 | 28.1 | 34.64 |
| 52 |  Cameroon Cameroon |
41.03 | 25.33 | 33.71 |
| 53 |  Sudan Sudan |
45.21 | 18.08 | 32.16 |
| 54 |  Burkina Faso Burkina Faso |
34.76 | 23.66 | 29.68 |
| 55 |  Ethiopia Ethiopia |
41.39 | 2.34 | 22.22 |
| 56 |  Sierra Leone Sierra Leone |
29.7 | 13.13 | 21.76 |
| 57 |  Haiti Haiti |
21.82 | 5.97 | 14.12 |
| 58 |  Yemen Yemen |
0 | 0 | 0 |
How Does the ADI Work?
The ADI does not measure actual broadband prices, nor does it tell us how affordable broadband is in a given country. Instead, it scores countries across two main policy groups: (1) infrastructure (i.e., the extent to which ICT infrastructure has been deployed as well as the policy framework in place to encourage future infrastructure expansion); and (2) access (i.e., current broadband adoption rates as well as the policy framework in place to enable equitable access).
Each country is awarded a score (out of 100) across a range of variables within each grouping, and is then ranked against the other countries in the ADI. Higher scores indicate the existence of a combination of factors which contribute to lower the cost structure for broadband provision and eventually lower prices.
High ADI scores are correlated with reduced broadband costs — both for industry and for consumers. As highlighted in the figure below, there is a negative and statistically significant correlation between the ADI score and the price of 1GB mobile prepaid data plan. (The same is true for a 500MB mobile data plan; please see Appendix 5 for that analysis.)
Figure 2. Relationship between ADI Score and Price of a 1GB Prepaid Mobile Plan (as % of GNI per capita, 2015)
The rankings reflect a country’s relative performance compared to other countries — this means that even if a country does reasonably well on the ADI, if it does not perform better than others then its ranking will not improve. For more detail on the methodology used for the ADI, please see Appendix 2.
2.1Which Countries Top the 2017 ADI?
This year, Latin American countries once again dominate the top of the ADI rankings. Colombia, Mexico, Peru and and Costa Rica all rank within the top five on the ADI, and all experienced an above average increase in their ADI score from 2016 to 2017.
For the second year running, Colombia is the top-ranked country in the ADI thanks to increases in available international bandwidth, improvements in competition policy (e.g., the Plan for Dispute Resolutions in the Telecommunications Sector, launched in January 2016), and the expansion of access to under-served areas through programmes such as the Plan Vive Digital. The country has also recently launched a new programme to subsidise the cost of both data and devices for those living in poverty and those who have never been online before. (See case study below for more detail.)
Mexico moved up seven places in this year’s ADI, thanks in part to a set of legislative reforms introduced in August 2014, which created an independent regulator, improved market competition, and led to more transparency and openness in regulatory decision-making. (These reforms are described in more detail in the box highlight in Section 4.)
Both Peru and Malaysia continue to perform well (and above the global average) — particularly when it comes to developing and implementing effective broadband policies, policies to support infrastructure sharing, and policies to promote competition. Peru approved regulatory changes in 2015 to facilitate infrastructure sharing across operators, and the country’s regulator now makes current operator infrastructure sharing contracts openly available. Malaysia has increased internet penetration through implementation of time-bound targets set out in the country’s National Broadband Initiative (see box highlight on Malaysia in Section 4.)
Costa Rica boasts the second highest mobile broadband penetration rate (approximately 50%) among the 58 countries analysed for the ADI — an accomplishment that can be explained in part by the country’s effective use of its Universal Service and Access Fund (USAF) to expand connectivity. (For more detail, see the box highlight in Section 4.)
It should be noted that the performance of these countries is also distinguished by how much better they perform than the other countries studied (i.e., there is a significant gap in ADI scores between the top five and the countries below it). While the average gap in rankings between any two countries on the ADI is just over a point, the gap between Costa Rica (ranked fifth) and Ecuador (ranked sixth) is nearly four points. This is one of the highest gaps in the 2017 ADI rankings and suggests that the top five countries, as a group, are making greater progress towards improving broadband affordability than the other countries studied.
Delivering Key Enablers of Affordable Access: Colombia Leads the Pack Once Again
Having topped the ADI for two years running, Colombia clearly has a strong grasp on the policy framework needed to enable affordable internet for its population. This year, the nation’s policymakers continued to innovate, creating a new programme to expand connectivity to low-income citizens and those that have never before had access to the internet. The 2016 Internet Móvil Social para la Gente programme reflects Colombia’s continued commitment to increasing ICT access and use in the country, and its willingness to put budget toward these projects; the government has allocated 260,000 million pesos (US $89 million) from the country’s ICT Fund to implement this new programme over the next three years.
The programme focuses specifically on mobile connectivity and offers those eligible to participate: (1) a 3-4GB mobile data package for a reduced tariff of 6,000 pesos (just over US $2), with free access between 11pm and 5am; (2) the opportunity to purchase a subsidised 4G smartphone; and (3) free access to online government services, educational content, social networks, and messaging platforms.
The programme’s target market is those citizens who have never been online before — primarily low-income citizens, and those in geographically isolated locations. Participation in the programme is open to beneficiaries of the country’s social housing programme, as well as citizens that are registered as low-income in the national social subsidy identification programme, who are also residents of one of the 788 municipalities covered by the country’s National Fibre Optic Plan.
Making mobile data affordable is one key part of the affordability puzzle; another important component is making devices affordable and accessible to those looking to come online. Colombia’s programme recognises this reality by subsidising both data and the devices themselves. Subsidising the devices will also enable programme participants to ‘top-up’ their data allowance by using public WiFi, which recent A4AI research found to be an important way for many mobile users in Colombia to stay connected.
Colombia has made expanding internet access a national priority, partnering with the private sector to build and share infrastructure, and implementing targeted policies to improve connectivity among marginalised groups. This latest programme aims to continue this positive progress, and to take concrete steps toward achieving the government’s goal of 27 million broadband connections country-wide by 2018.
2.2Who’s Made the Biggest Improvements Since 2016?
A few countries experienced significant jumps in their ADI rankings this year — changes that stemmed primarily from the introduction of new or updated policies, or the effective implementation of existing ones.
| Country | 2017 Rank | 2016 Rank | Change in Rank (from 2016 to 2017) |
|---|---|---|---|
 Jordan Jordan |
27 | 40 | +13 |
 Benin Benin |
29 | 38 | +9 |
 Ecuador Ecuador |
6 | 15 | +9 |
 Botswana Botswana |
15 | 23 | +8 |
 Vietnam Vietnam |
16 | 24 | +8 |
Jordan moved up 13 spots to secure a 27th place ranking in this year’s ADI, as a result of three key developments: (1) the implementation of a simplified licensing regime; (2) new requirements that mandate infrastructure sharing among service providers; and (3) a programme to increase public internet access via ‘knowledge stations’ that target rural and under-served communities, and which offer affordable internet access, digital skills training, and access to other ICT services.
Benin also experienced a significant increase in its ADI ranking, moving up nine places from its 38th place ranking in 2016. This jump resulted thanks to incremental and separate improvements across a range of policy areas, and not the introduction of any single major reform. For example, the regulator now publishes more information on its regulations and decisions — a move which can help improve transparency in decision-making. It has also made further effort to hold operators accountable to providing good quality of services. Efforts to improve public consultation — including the ability to submit comments regarding proposed policies and regulations online — are promising, however in a country where just 7% of the population reported using the internet in 2015, other necessary forms of public consultation on regulatory decision-making are still rare.
Ecuador, Botswana, and Vietnam all introduced new regulations or policies that help to explain their rise in the ADI rankings.
Ecuador introduced a new telecommunications law in 2015 which, among other things, provides for a unified licensing regime, improves the extent to which public consultation is used as part of regulatory decision-making, and creates new rules on infrastructure sharing (to be enforced by the regulator).
In Botswana, the government introduced new rules in late 2015 that improve and simplify the existing multi-service licensing regime, and ensure technology and service neutrality — without restricting operators from holding different types of licenses (e.g., network, services, or content providers). Though further reforms will be required to achieve a unified licensing framework, it represents a step in the right direction. Botswana’s regulator also established a USAF in 2014, which has since been used to support several public access initiatives (see case study in Section 3 for more detail).
In 2016, Vietnam approved a new broadband strategy, which aims to expand mobile broadband coverage, calling for 3G/4G networks, with average download speeds of 4Mbps in urban areas and 2Mbps in rural areas, to reach 95% of residential areas. Other elements of the strategy directly address objectives to increase competition and reduce complexity and costs in the broadband telecommunications sector.
3
Employing Public Access Solutions to Close the Digital Divide
The fact that nearly 4 billion people globally remain offline and that the internet is only accessible to 40% of people in low- and middle-income countries is testament to the challenge of connectivity for all. The ability to go online via one’s mobile device or at home is one currently enjoyed by less than half of the global population, and getting online where and when convenient is not an easy task for many in under-served or impoverished communities. For this to change, governments need to complement other broadband initiatives with a push to ensure public access is an imperative in national policies and regulations.
Public access refers to a wide range of approaches to provide access to the internet in spaces that are open to the public. This includes the provision of internet services on a free, low-cost, or paid commercial basis. Government, civil society groups, businesses, community groups, and others offer public access services in a wide range of places, from public libraries, community centres and post offices, to shopping malls, cafes, and bus stops.
In many countries, private internet access for everyone is an unrealistic target, considering the number of people living in poverty. Indeed, for the poorest, public access may not just be a ‘transition’ solution, but the main means of access for a long time, or at least until income and price come to a balancing point where private access solutions are feasible for the majority.
Even once this balancing point has been reached, many cities and national governments in high- and middle-income countries choose to expand, not shrink, their budgets for free public access. They believe that public access is essential to ensure that everyone can participate equally in civic life and make full use of the information, open data, and services that government provides online. As New York City mayor Bill de Blasio explained when announcing a major new public access initiative:
“It’s essential for everything we need to do to be a fair and just city. In a vibrant democracy, it all runs through broadband access.”
Public access facilities also often offer educational programmes like digital skills training, which in turn can promote local content development, and can stimulate greater demand for online services.
The technologies that public access facilities employ can also vary depending on context. In some cases — particularly via government-supported programmes — users will have access to the internet on computers (e.g., the traditional telecentre model). In other cases, access to the internet is provided via WiFi, with users providing their own internet-enabled devices in order to connect. Public WiFi (i.e., public internet access via WiFi hotspots available to anyone in spaces open to the public) and community networks (which we define here as community-owned and managed networks that provide internet access to the public) have both become important public access options, and are discussed in further detail below.
The potential of public access solutions to enable connectivity among those that still cannot afford to connect is significant and for the most part, remains untapped. In an ideal situation, a country would make a specific provision for public internet access part of — and even central to — its broadband policies and regulations. But what are countries actually doing to increase public access offerings? How many have specific policies in place to promote free or low-cost public internet access (e.g., budget allocations for internet access in public libraries and community centres, or provisions for spectrum use by community WiFi options)? Have any countries specifically provided for public internet access as part of their broadband policies and regulations, or laid out plans for developing and promoting access to public WiFi and community networks?
3.1Public Access Solutions Remain Underutilised and Potential Untapped
On average, the improvements made by the 58 countries assessed for the ADI with regards to their public access policies and programmes have been marginal.
Figure 3. Average Public Access Policy Survey Scores by Income Group (Scores 0-10)
There is much room for improvement across the board, especially as governments in all regions have announced and launched ambitious e-government projects and open data initiatives to provide public services and information to their citizens. Such plans will fail to achieve their public policy goals if the majority of those they intend to serve remain offline and have no options to connect and access those services. Upper-middle income countries score higher when it comes to public access, yet even among this relatively well-performing group, the average score was not even seven out of 10. Low-income and lower-middle-income countries all scored around five or below, indicating that there are very few policies in place to effectively support public access.
If governments and service providers are serious about open data and e-government services provision, they must ensure that all citizens are afforded access to the internet. In low-income and lower-middle income countries, where a large proportion of the population is unable to afford existing broadband services, the potential impact of public access facilities on internet access and use is particularly significant. If left unchanged, this failure to prioritise public access will lead to failed e-government agendas.
3.2Public Access Makes Sense: Lessons from Experience
Our analysis shows that Colombia, Costa Rica, Ecuador, Rwanda and Turkey score higher than their peers on public access policy, thanks to the development and implementation of policies to support the expansion of public access. An examination of the policies in place across these countries reveal a number of common features that have contributed to real impact on the ground, including:
- Prioritisation of public access in rural and low-income communities. As explored in a case study above, Colombia’s Vive Digital programme sets up telecentres in rural communities and provides computers to educational facilities; similarly, Turkey’s Fatih programme lays out plans to provide ICT devices and broadband internet access to schools nationwide.
- Subsidised or free broadband access and/or access to subsidised devices. Costa Rica’s Connected Homes project, for example, uses the national USAF to subsidise the cost of devices and broadband services to low-income households.
- Digital skills training. Both Colombia and Turkey have programmes to provide digital skills training — Colombia’s Vive Digital programme trains teachers in the use of ICTs, while Turkey’s Fatih programme offers ICT training to students and classrooms across the country.
- Provision of public WiFi. Botswana (explored in the case study below) has used its USAF to fund the development of WiFi hotspots in public sites. In South Africa, municipal governments, such as those in Tshwane and Cape Town, have launched free public WiFi networks as a strategy for getting more people online.
Public Access in Botswana: Turning Public Funds into Public WiFi
Over the last few years, Botswana has implemented a successful, USAF-funded strategy to provide public access to its population, primarily through the use of public WiFi hotspots. Funds from the country’s USAF (created in 2014) have facilitated the provision of WiFi hotspots in 31 sites (e.g., hospitals, bus stops, taxi ranks, shopping malls) across seven towns. A wholesale service provider offers backhaul services to retailers on an open-access basis and in turn, these retailers offer WiFi hotspot services to consumers.
These hotspots provide the public with 30 minutes of free internet access daily and free and unlimited access to select Government of Botswana websites. Individuals also have the option to top-up their connection by purchasing vouchers. The USAF subsidises the costs of the wholesale network, thereby making it cheaper for consumers to access the WiFi hotspots. At the end of 2016, 1GB vouchers were available for a little over US $8 — much lower than the US $28 it costs to purchase 1GB of mobile prepaid data. Vouchers can be purchased online or at a number of other venues, and consumers have the option to pay for vouchers using mobile money.
Botswana is now preparing to use USAF funds to supply computers and broadband access to primary schools in remote and rural areas of the country. In line with this aim, it is also making a renewed push to revive the country’s Kitsong centres — public access centres equipped with computers, printers, copiers and data cards — many of which have not survived as a result of limited government and private sector support.
The challenge Botswana currently faces is a lack of policy clarity on how to sustain these notable public access and public WiFi initiatives. The National Broadband Strategy (2013) notes the challenges of the Kitsong model, highlighting issues with proper management and operation. In addition, other challenges to wider broadband access remain, including high retail prices and wholesale prices.
3.3Public WiFi: A Big Opportunity to Connect the Unconnected
As the Botswana example illustrates, public WiFi can be critical to engendering further use of the internet, particularly across developing countries. A4AI research has shown that across a number of low- and middle-income countries, public WiFi is, in fact, one of the most popular options for online access. A survey of 8,000 users across eight developing countries found that users often combine public WiFi with other paid mobile data services to meet their online needs and to keep costs low. Indeed, public WiFi (including in libraries and community centres) can support women and low-income populations by connecting these groups to the internet, at low or no cost.
Figure 4. Proportion of Mobile Internet Users in Select Countries that Use Public WiFi (2016)
The potential of public WiFi is being recognised by governments as a way of addressing the affordability challenge. The President of Tanzania, Samia Suluhu Hassan, recently launched a project to install WiFi services in public spaces and recreational venues in Dar Es Salaam. The project will be implemented by the Tanzania Telecommunication Company Limited to expand connectivity and online access for citizens, with the goal of creating a ‘smart city’.
Similarly, the Government of the Philippines has pledged to extend its public WiFi programme beyond Manila to the rest of the archipelago. The free wireless service will be made available in public areas including schools, hospitals, airports and parks; citizens will be able to use a government-supplied digital ID to log in to the WiFi services and will be permitted to use up to 3GB of data per month.
In India, the government recently announced its intention to roll out free public WiFi to over 1050 villages across the country, as part of its Digital Village programme. Each village will have a WiFi hotspot installed, which villagers can access using their mobile phones.
Making Public WiFi Work for Users: Suggested Policy Guidelines
While public WiFi does provide significant opportunities as an option for enabling wider public internet access, there are several areas of potential concern with regard to user privacy, security, and safety. As these networks increase in popularity, it’s important that governments ensure that these concerns are addressed. Policy guidelines for public WiFi networks should ideally be developed via public consultation, and the following suggested guidelines offer a good starting framework. (Note that significant technical issues such as minimum requirements for network security or efficiency are not addressed here.)
- Clarify Terms of Service or Acceptable Use Policies: Whether public WiFi services are offered on a free or paid basis, terms of service policies should be accessible and clear to all users. Convoluted language and difficult-to-read fonts often leave users unable to understand the terms under which the service is being provided. The government can be proactive in this regard by working with service providers to develop a clear and easy-to-understand Terms of Service or Acceptable Use Policy template.
- Protect the Consumer: While adherence to local and international law is important, users of public WiFi should also enjoy consumer protections with feasible options for legal recourse where available, as they would in any other sector.
- Ensure User Privacy: Service providers should ensure the privacy of each user’s online activity. Records of these activities (where they are recorded) should not be used for any purpose other than those noted in the Terms of Service and not without the user’s permission. For example, some service providers may collect user data for sale to other companies (e.g., data brokers). Users should be made fully aware of this activity and should be able to consent to — or opt out of — this use of their data.
- Eliminate Invasive Registration Requirements: In some cases, public WiFi networks are open and do not require users to log in or provide a password. In other cases, users are required to submit some information in order to access the network. Generally, this involves submitting a name and valid email address, but in other instances, users are required to submit potentially sensitive information (e.g., national ID data, passport numbers, telephone numbers) or to register their device with a government agency in order to access the service. These registration requirements place a great amount of risk on users’ privacy and security, not least because it is relatively easy to harvest data from public WiFi networks — even if they are password protected. These practices also increase the potential damage that can be inflicted by fraudsters — or overreaching law enforcement agencies. The risks presented to users required to submit sensitive information far outweigh any benefits provided to governments and their partners, so this practice should be prohibited.
- Prevent Harassment: Physical harassment of women, girls, and other user groups is a reality in public spaces in many countries. In cases where a public WiFi service is provided in a space controlled by the service provider, providers should work with their users to prevent harassment by, for example, educating users and customers about this problem. Service providers should also work with law enforcement to prevent such activities from occurring on their premises, as they would in any other sector. In addition, service providers should also be aware of online harassment of users and should point them to available resources and tools to report online harassment.
- Increase Public Awareness of Public WiFi Security: Users of public WiFi are often completely unaware of the security risks they face when using such networks, especially on open networks (i.e., those with no passwords). Users should be educated about these risks and the precautions they can take to improve their online security (e.g., using websites with https protocol, using VPNs, avoiding phishing schemes, etc.).
3.4Community Networks: Supporting Public Access by Addressing Market Failures
For many in the ICT space, ‘public access’ brings to mind the telecentre movement, which, in the 1990s, saw thousands of facilities throughout the world setup to provide the public with access to and training in ICTs. However, a number of telecentres fell out of use after a few years — often as a result of limited sustainability. The top-down planning approach used in most instances led to telecentre locations being decided without community input, and allowed politicians to influence the planning process in a way that would be advantageous to their aims, as opposed to community needs. This approach also meant that practical problems with the centres often went unnoticed and unaddressed. For example, to use a school as a public access facility for the community also requires support for paid staff to work beyond school hours, financial support for additional electricity used, and a shared responsibility for maintaining equipment; when these issues were not addressed, sites were closed, or fell into disuse.
In response to some of these challenges, community networks have emerged as an increasingly popular means to providing public access — particularly for rural communities — and are an important strategy for governments to consider as part of a policy framework to achieve universal access. Community networks are a subset of crowdsourced networks, designed to be open, free, and neutral, and often reliant on shared infrastructure as a common resource. They are generally owned collectively, employ social management, open design, and open participation principles, and use technologies and software based on open standards. Although they can vary in the type of services they provide, we are focused here on those that offer the public access to the internet.
Though the ability of community members to own and operate these local connectivity solutions helps to tackle some sustainability concerns, it is important to consider the training and financial support that is needed to ensure the sustainability of these initiatives. Government and private sector entities can step in to support or fill in these funding gaps — a move that is likely to have long-term socio-economic benefits for them as well. In India, the Wireless for Communities programme offers an interesting example of an initiative working actively to address the sustainability challenge, and is explored in more detail below.
Governments can also support community networks as a public access solution to affordability challenges through policy that opens up the space these networks need to operate. In Mexico, for example, the government in mid-2014 assigned spectrum, on an experimental basis, to develop community networks in indigenous areas in the state of Oaxaca. After the success of this trial, the government announced a plan to reserve certain blocs of spectrum for community use under non-profit licenses. Spectrum allocation can enable the development of community networks, and can be further supported through the award of special licenses for this purpose, or through allowances to use unlicensed spectrum, where feasible. Governments can also support community networks by facilitating — and even incentivising — partnerships with mobile phone operators.
Building Sustainable Wireless Community Networks: Experiences from India
Written by Ritu Srivastava, Digital Empowerment Foundation
In India, the Digital Empowerment Foundation (DEF) is working to provide affordable, ubiquitous and democratically controlled internet access in rural regions of the country through its Wireless for Communities (W4C) programme.
W4C works to create community-owned and operated wireless networks, employing WiFi equipment and infrastructure that use unlicensed spectrum (i.e., 2.4GHz and 5.8 GHz). These networks are providing access in typically under-served areas and are currently used by over 4,200 people in 38 districts across the country. DEF emphasises community involvement at all stages — community members are involved in decision-making, and are trained to build and manage the networks.
The W4C network aims to maximise the benefits of wireless technology for rural populations, enabling community economic development that can reduce poverty, and encouraging increased civic participation. In addition to providing the network, the W4C programme offers the communities ICT and vocational training, and enables a large number of users, including local tribes or adivasis, to use wireless infrastructure and facilities for both self-development and community development.
Operating in a financially and socially sustainable manner is critical to the success of the project. While W4C received grants from the Internet Society to develop infrastructure and provide training, it continues to earn revenue by (1) charging a small fee for providing connectivity to households, small institutes, NGOs, and small and micro-businesses; and (2) charging customers a small fee for courses, internet access, and online services (e.g., e-ticketing and digital literacy programmes) offered at the community service centre. W4C also took steps to ensure long-term viability and reduce costs, including by using refurbished computers and training community members to maintain the network.
Examples of fees and other activities that can promote the financial sustainability of the wireless community networks include the following:
- Fees for providing community broadcasting services (e.g, movies, documentaries, etc.);
- Minimal fees for providing internet-related services and trainings;
- Identification of local partners for collaboration and further network support; and
- Development of a local e-commerce portal for community members to sell their products online.
Although they vary based on local needs and demand, current fees for internet access can start at around INR 100 (approximately US $1.50) per plan per month, depending on the speed required (e.g., 512 Mbps up to 2 Mbps). Note that these plans have no data limit and no restrictions on what sites can be accessed.
Looking to the future, DEF has created a social enterprise called Villages of India Networks (VOIN) to run and manage all community networks in a sustainable manner. The continued focus is directing profits back into building more community networks.
4
Implementing Policies to Achieve the “1 for 2” Broadband Affordability Target
As we’ve highlighted in previous reports, there is no single strategy or policy that alone can lead to more affordable broadband. For any of the different types of public access strategies discussed above to be effective, there also needs to be a complementary and supportive policy environment in place. For example, reserving spectrum for community networks requires a strong spectrum policy and management regime to be in place, while the use of USAFs to support public WiFi requires an effective policy framework to support and manage the fund. It is critical that public access strategies be approached as part of — and in coordination with — a cohesive broadband strategy.
Between June and September 2016, we conducted expert policy surveys across the 58 countries analysed in the ADI in order to gain insights into individual country efforts to implement policies designed to improve broadband affordability and access. What policies are countries implementing — and what are they failing to tackle? What policies seem to be working to drive down industry and consumer connectivity costs? Which ones are not?
There are several important and inter-connected policy areas that governments must focus on in order to lower the cost structure for broadband and improve affordability. In this section, we take a closer look at these policies, and how these are being put into action by countries around the globe.
We identify five major policy themes which contribute to driving down the price of broadband connectivity, based on the A4AI’s broadly agreed Policy and Regulatory Good Practices:
- Effective policies and regulation for competition;
- Detailed and efficient broadband strategies;
- Cohesive spectrum policy and access to spectrum;
- Infrastructure and resource sharing; and
- Policies to support Universal Service Access Funds (USAFs) and public access.
Comparing these latest survey results with data collected in 2014, we can see that countries assessed for the ADI have made only incremental progress across each of these five policy areas. Overall, the average increase in policy scores across all areas was only 10%, indicating the slow pace of policy and regulatory progress. This is a major concern, particularly given that growth in mobile broadband adoption is slowing and the fact that a significant proportion of the population of the countries surveyed here is still unable to afford a basic connection.
The modest gains over the past two years have been highest in policy for infrastructure sharing and policies to support USAFs and public access. While policy and regulation for competition remains, for most countries, the strongest-performing area (with an average score of 5.2 out of a possible 10), there remains tremendous room for improvement.
Figure 5. Global Average Policy Scores by Theme, 2014 and 2016 (Scores 0-10)
What are the steps that countries can take to improve their performance and accelerate progress toward affordable internet access for all?
4.1Foster Market Competition Through Smart Policy
Overall, several countries are making efforts to ensure that policies and regulation to foster competition are implemented effectively and follow good practices in the sector.
A series of recent legislative reforms in Mexico have reduced market restrictions, taking steps to reduce sector monopoly of dominant companies and ease entry for potential new broadband operators in the space. (For more on Mexico’s reforms, please see the box below.)
Botswana has also implemented reforms to ease market entry, increase competition, and improve regulatory decision-making. The country’s new ICT licensing framework, implemented in September 2015, allows for technology and service neutrality, promotes multiple services on single networks/platforms, and encourages public consultation. Enforcement guidelines for the country’s regulatory authority (BOCRA) were updated in July 2016, and they now submit monthly, quarterly and annual reports on the state of the telecommunications industry.
Ecuador, Nepal, and Mozambique have all also introduced new policies to promote competition, establish rules for assessing and addressing anti-competitive behaviour, and support better and more affordable services to users.
Legislative Reforms Change Competitive Dynamics and Increase Affordable Access in Mexico
Recent legislative reforms in Mexico aim to promote healthy market competition and have revolutionised competitive dynamics in the country’s telecommunications sector. The 2014 Federal Telecommunications and Broadcasting Law reduces market restrictions that might impede efficient sector functioning, requires the implementation of public consultations and other regulatory mechanisms to improve transparency, and establishes technology neutrality as a foundation for spectrum allocation and the provision of telecommunication network and interconnection services.
Mexico’s new legal framework also lays out a unified licensing regime for the provision of public telecommunications and broadcasting services, and established a new autonomous regulator (the Federal Telecommunications Institute or IFT). IFT has taken steps to reduce the monopoly of dominant companies, increase competition in the market, punish non-competitive practices through the withdrawal of operator licenses and the application of asymmetric regulation. The IFT website also features a platform specifically dedicated to public consultations, with post-consultation summaries published on the site. A consultative council which sits within IFT, provides recommendations on issues and proposes changes to existing laws and processes.
The Federal Commission for Regulatory Strengthening (COFEMER) provides studies and technical assistance for federal authorities and municipal governments regarding initiatives aimed at improving the effectiveness of regulatory frameworks. A number of Research Impact Assessments (RIA) have been carried out to improve regulation through evidence-based approaches.
Since the implementation of the new law, market concentration in Mexico has reduced, new operators have entered the market, and mobile prices have dropped by close to 17%. Thanks in part to these reforms, Mexico’s performance in the ADI has improved, and the country’s ranking has jumped seven places since last year.
Despite the progress made in countries like Mexico and Botswana, greater efforts are needed overall. Countries need to focus on changing outdated legislation to ensure regulatory independence, and to ensure that public consultation is built into decision-making processes.
Another issue facing countries across all the regions studied is the outdated licensing frameworks that still determine market rules and structures — despite tremendous changes and advances in the technology we use. Haiti offers an extreme example: there, the law regulating telecommunications dates back to the 1970s, and the law establishing the regulator dates back to 1969. In the wake of Hurricane Matthew in 2016, the government started discussions to update the laws, but these have not yet yielded results.
In countries where regulatory independence is limited, it can be difficult to develop forward-looking policy or regulatory instruments to promote growth and incentivise innovation. In Thailand, for example, the regulatory body is highly influenced by the military regime and decisions are frequently made in accordance with the regime’s goals, instead of the National Broadcasting and Telecommunications Act.
4.2Ensure Effective Broadband Planning Turns Into Effective Implementation
Broadband strategies that address both supply and demand for broadband services are essential for improving internet affordability and access. The urgency and need for a broadband plan is clear to most policymakers — a point reflected in the fact that most countries studied now have some kind of plan or strategy in place. There are several important components of effective broadband plans, including: the need to address the policy needs of current technologies (also suggesting that these plans be updated regularly); to have clear and measurable time-bound targets, and; to provide for adequate investment in resources to support the implementation of the plan.
Across the countries reviewed, there was an overall increase in the introduction of new broadband plans, as well as in the implementation of existing plans. In total, 49 out of 58 countries have publicly available broadband plans (i.e., information released as part of a policy, plan or strategy that details a national policy position on broadband).
However, out of the 49 existing publicly available plans, five have expired and have yet to be updated or re-released: Turkey, the Gambia, Sudan, Nepal, and Ecuador. In addition, 10 plans are more than five years old. This is not to say that the content of the plans is irrelevant but, as noted above, regularly updated plans are essential given the fast-changing pace of telecommunications.
Broadband plans should also should set clear targets with explicit timelines that the government, regulator, and telecommunications industry can follow and abide. Plans that set out time-bound interventions and benchmarks for providers and ICT regulators tend to see more success in efforts to improve access and use, and reduce costs. Malaysia’s high-speed broadband project — laid out in the country’s national broadband plan — offers good insight into how that country has used clear targets and timelines to accelerate internet access and use, and is explored in detail in the box below.
Infrastructure development and investment is typically central to broadband plans. A number of countries — many of them in Latin America — have rolled out broadband infrastructure and have invested in related infrastructure as part of their broadband strategies. Argentina, for example, has rolled out 30,000 km of fibre optic cables to connect all Argentinian provinces, as part of its National Broadband Plan (Argentina Conectada). Other countries, however, continue to struggle with implementation of plans laid out in their broadband strategies, and actual public investment in broadband infrastructure is limited. Bangladesh’s Social Obligation Fund, for example, is designed to fund the extension of telecommunications facilities in underprivileged areas, but there is no recent history of direct public infrastructure investment in broadband.
Time-bound and Targeted Broadband Planning in Malaysia
Malaysia, which ranked 4th in this year’s ADI, increased internet penetration from 57% (2013) to 71% (2015) of its 30 million citizens. Part of the reason behind this growth in use is Malaysia’s National Broadband Initiative (NBI), which aims to bring high-speed, affordable broadband to the whole country. Implemented by the Malaysian Communications and Multimedia Commission (MCMC) in 2010, this initiative stands out for its clear timeline and set of targets to expand coverage and use throughout the entire country.
The NBI details specific targets on both the supply and demand sides of broadband. Under the supply side, the broadband service groups are split into two categories: High Speed Broadband (HSBB), which focuses on selected high impact and industrial areas, and Broadband for General Population (BBGP), which covers suburban and rural areas. Each initiative has a detailed project scope, with targeted areas, timelines, information on infrastructure, and project status.
BBGP aims to ensure there is enough broadband coverage in under-resourced and rural areas by: focusing on infrastructure deployment to expand wired and wireless connectivity; upgrading 2G services to 3G and LTE; and expanding broadband coverage using the MCMC’s Universal Service Provision (USP) fund. Two of the three phases of the BBGP have already been completed. The third phase involves expanding the fibre optic backhaul network to more rural areas. The table below shows a summary of the project’s three phases:
| Phase 1 | Phase 2 | Phase 3 | |
| Timeline | 2012-2013 | 2014 | 2016-2017 |
| Target areas | Sabah & Sarawak | Perak, Terengganu & Kedah | Perak, Terengganu & Pahang |
| Total no. of links | 76 | 7 | 4 |
| Total fiber length (KM) | 2,653 | 172 | 154 |
| Status | Completed | Completed | On-going |
The HSBB project is a public-private partnership (PPP) agreement between the Malaysian government and Telecom Malaysia, Malaysia’s largest telecommunications company, to build a network to facilitate broadband penetration. The first phase of HSBB (2008-2013) surpassed its target of deploying 1.3 million ports (i.e., connection points through which customers can connect their households or businesses to the network, once they subscribe to a broadband service) in Inner Klang Valley, Iskandar Malaysia and other industrial areas, instead providing 1.9 million ports.
The target for the second phase of HSBB (2013-2018) is to install 390,000 ports in capital cities and high impact areas by 2018. As of October 2016, over 267,000 ports had been provided, and the project continues to deploy necessary infrastructure for high-speed internet across the country, including the upgrade of 95 exchanges.
| Items | HSBB1 | HSBB2 |
| Project Scope | Implement high speed broadband infrastructure end-to-end including access, core and international network Enable speed capability up to 100Mbps |
Implement high speed broadband infrastructure including access and core network Enable speed capability up to 100Mbps |
| Implementation period | 2009 – 2012 | 2015 – 2017 |
| Target areas | Inner Klang Valley, Iskandar Malaysia and selected industrial areas | All capital cities and selected high impact areas |
| No of connection points (target) | 1.3 million | 390,000 |
| No of connection points (achieved) | 1.9 million | 267,486 |
| Status | Completed | On-going |
4.3Implement Innovative Uses of Spectrum Through Transparent Policy
The availability of sufficient spectrum on a timely basis is another critical factor in managing the cost structure for broadband. To reduce the cost of accessing wireless networks, spectrum must be made available on a competitive and non-discriminatory basis or, in some cases, spectrum bands may be offered on a license-exempt basis. Either way, a clear strategy to allocate available spectrum so that it meets mobile broadband user demands is required.
Brazil’s approach to spectrum management offers an effective example. The country’s national regulator, Agência Nacional de Telecomunicacoes (ANATEL), issues a spectrum allocation plan, which assigns bands to certain services as demand grows, and holds auctions to grant authorisation for the use of radio frequencies. Public input into plans is also taken into consideration, as to verify public interest in and understanding of bands for broadband. Thanks in part to these practices, Brazil meets the ‘1 for 2’ affordability target, with mobile broadband prices that have decreased consistently over the past three years.
Pakistan, by contrast, has no spectrum implementation plan. General pronouncements on increasing available broadband spectrum have not been backed by any concrete plans or roadmaps with time-bound benchmarks, nor has the country’s Frequency Allocation Board issued any public information on potential plans. This lack of any plan or openness about spectrum policy increases uncertainty in the market.
In South Africa, a proposed spectrum auction turned into a bitter dispute between the Ministry of Telecommunications and Postal Services, and the regulator, the Independent Communications Authority of South Africa (ICASA). After ICASA published plans in July 2016 for a spectrum auction, the Ministry responded by taking ICASA to court; in September 2016, the South African High Court ruled in the Ministry’s favour, effectively halting the auction. The net effect has been to create uncertainty and delay the release of much-needed spectrum. This represents a cautionary tale for the need for clear lines of communications between ministries and regulators.
Sri Lanka, which does not yet have a publicly available spectrum plan, has worked to implement good practices for spectrum use; the government has made some advances in spectrum planning, but needs to take additional steps to ensure spectrum availability in the future, as explored in the box below.
A Plan to Keep Spectrum Sustainable in Sri Lanka
Sri Lanka is a new addition to the Affordability Report this year. As one of the first Asian nations to make 3G spectrum available (in 2004), Sri Lanka has some of the lowest broadband prices in the world (1GB of mobile broadband costs less than 0.5% of an average monthly income). There have been significant investments in wireless and fibre networks throughout Sri Lanka, and the country also participates in and benefits from regional spectrum harmonisation.
Sri Lanka has allocated bands in 900 MHz and 2100 MHz, which are assigned to five mobile operators: Bharti Airtel, Dialog, Hutchison, Etisalat, and state-owned provider Mobitel. Dialog is the largest telecommunications service provider, and has more allocated spectrum than the other operators.
Sri Lanka has also taken several innovative steps in spectrum allocation. Sri Lanka was also one of the first lower-middle income countries to re-farm spectrum. This process involved an open consultation process, which enabled more equity in spectrum allocated between incumbent and new operators. The country is also involved in Project Loon — an Alphabet (formerly Google)-led project to extend internet connectivity to people in rural and remote areas via a network of balloons traveling on the edge of space. The Sri Lankan government leases spectrum to Google and US-based Social Capital in exchange for a 25% holding in Google’s local Project Loon unit.
Despite all this, Sri Lanka has no formal spectrum policy. The Telecommunications Regulatory Commission of Sri Lanka (TRCSL) is taking action to ensure more spectrum is available, but there is as yet no specific plan to enable this. Spectrum policy and implementation should be prioritised in the near future — particularly since some of its licenses will expire in 2017 (900MHz,1800MHz) and 2018 (900MHz).
4.4Take Urgent Action to Promote Infrastructure and Resource Sharing
Infrastructure sharing can lower network deployment costs and operating expenditure for mobile operators and other internet service providers (ISPs), translating into likely lower prices for consumers. A 2015 APC-led study estimated that the savings from two operators sharing the same tower infrastructure could be 45% of the cost of one of these operators deploying the same infrastructure individually. More recently, an A4AI-supported study in the Dominican Republic revealed that sharing could lead to as much as 50% savings in investment, operation, and maintenance of towers in urban and rural areas.
There are a number of advantages to infrastructure sharing in addition to the cost saving benefits, including optimisation of scarce resources, increased potential for network expansion, and a reduced environmental and visual impact.
Advantages of Sharing Infrastructure
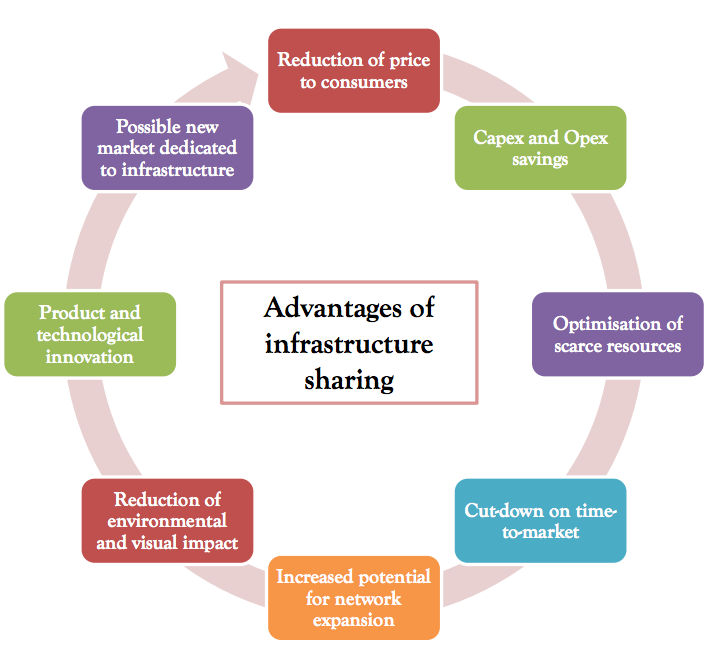
Source: A4AI and Vieira de Almeida, Ghana infrastructure sharing project and open access study, (2016)
To unlock these cost savings, countries need to prioritise: (1) streamlined processes for infrastructure deployment and sharing; (2) efficient and effective access to public rights of way; and (3) tower zoning. Sharing must be coordinated with other infrastructure projects (for example, fibre or duct laid during road works). Indeed, as we noted in our response to a call for comments by the Tunisian regulator (INTT) in 2016 on infrastructure sharing on fibre networks, countries should take a cross-sectoral approach that involves all utilities (e.g., energy, power, transportation, roads and highways) to coordinate infrastructure deployment and benefit from cost savings.
Several recent experiences provide good practices to consider, including the incorporation of a fibre network deployment in the Doba-Kribi oil pipeline between Cameroon and Chad, or the leasing of passive capacity in Ghana by the National Electricity power transmission provider, Ghana Grid Company (GRIDCO), to mobile network operators in the country.
There are some promising signs of movement in other countries, as well. Peru’s regulatory framework ensures efficient access to public rights of way and tower zoning, and a 2015 law calling for the development of a national fibre network makes clear that this infrastructure should be made available to operators on a non-discriminatory basis.
Overall, however, progress to advance infrastructure sharing has been slow. Some countries — including Cameroon and Mali — have introduced new policies to address infrastructure sharing, but have yet to begin implementation of these frameworks. Developing and putting into action the implementing policies needed to support this kind of infrastructure sharing is a frequent challenge, as the below box on Turkey illustrates.
Moving from Theory to Practice: Implementation of Infrastructure Sharing Policy Remains a Challenge in Turkey
Infrastructure and rights of way in Turkey are facilitated by policies that regulate sharing, public rights of way, tower zoning, and resource sharing. Yet, despite these policies existing on paper, impact is limited by a lack of action and implementation.
The regulations and bylaws that detail infrastructure sharing and rights of way include the Electronic Communications Law (2008), the Bylaw on Access and Interconnections (2009), and the bylaw for Procedures and Principles Regarding Design, Installation and Sharing of Cellular System Antenna Facilities. These policies and provisions are the legal, publicly available documents which allow for authorisations, rights of way, access and interconnection, obligations and tariffs that can be imposed on operators. Turkey’s regulator, the Information and Communication Technologies Authority (ICTA), has legislative power to enforce these changes.
All operators authorised to set up and operate fixed electronic communications infrastructure are obliged to provide facility sharing services and to negotiate on interconnection with other operators upon request. If no agreement is found between the parties after two months of an access request being submitted, either operator may request the ICTA to initiate dispute settlement proceedings.
This was the case for Türk Telekom, the formerly state-owned Turkish telecommunications company and the dominant operator in the country. Despite Turk Telekom’s partial privatisation in 2005, progress in competition as well as infrastructure development has remained slow. By 2009, it was established that Türk Telecom had Significant Market Power, and as such, was required to abide by a number of obligations, including the provision of access and/or interconnection, the publication of reference access and/or interconnection offers, and facility sharing.
Whether Türk Telekom has contributed to sharing infrastructure is a point of contention. Despite the Ministry encouraging Türk Telekom to reach agreements with other providers for right-of-way concessions, operators have been unable to do so due to lack of responsiveness on the part of Türk Telekom. This in turn has restricted competition and the growth of the sector overall. Given the lack of clarity on why this situation persists, the Ministry and the regulator need to do more to ensure that infrastructure sharing policies are implemented in a transparent and open manner, so that the sector, as a whole, can improve.
4.5Make Effective Use of Universal Service and Access Funds (It Is Possible!)
Existing and active Universal Services and Access Funds (USAFs) show country commitment to investing in broadband infrastructure and internet uptake and, if used correctly, are effective in expanding access — but only if their mandate is regularly updated and adapted to support national broadband strategies and targets.
For USAFs to make a meaningful impact, they must operate under non-discriminatory conditions (including fair collection and distribution), and according to transparent and consultative processes, incorporating stakeholder inputs and priorities (including those of the private sector and civil society.) Effective fund administration also requires the prioritisation of clear target goals, and monitoring to measure the effectiveness and impact of USAF programmes and projects. In addition, one-time infrastructure and other expenditures to enable access must be prioritised. Any ongoing subsidies must be targeted to individuals rather than providers.
Costa Rica has introduced policy changes for universal and public access, and has made effective use of its USAF to expand affordable access.
Costa Rica Invests in Improving Country Connectivity
Year on year, Costa Rica ranks among the top performers in the ADI, with scores that reflect improved infrastructure and access indicators — mobile broadband penetration is approximately 50% and a basic broadband plan is relatively affordable, priced at around 2% of monthly GNI per capita. The country’s National Telecommunications Fund (FONATEL) is partly responsible for these positive outcomes.
FONATEL was created in 2012 to manage resources designed to achieve universal access and service; it aims to promote access to telecommunication services in a timely, efficient, affordable, and competitive manner and to advance connectivity and access in under-served communities with poor or vulnerable populations. It focuses on connecting communities (e.g., through schools and community centres), households (including those of seniors, women entrepreneurs, the disabled, etc.), and public sector organisations, and also works to establish local WiFi networks.
Infrastructure development and investment are top priorities for FONATEL — priorities that have helped to increase access and reduce broadband costs. FONATEL funds are also used to subsidise device costs, as well as broadband access for end users, via four main programmes Connected Communities; Connected Homes; Public Equipped Centers; and Connected Public Spaces. The Connected Homes project — which won the ITU’s WSIS 2016 Prize — subsidises devices and connection by up to 80%.
In March, 2016, FONATEL announced plans to invest US $57 million in internet access projects, subsidies, and hotspots. The projects, which will be implemented by the Costa Rican Electricity Institute, Telefonica, and Claro, will target the provision of broadband access to schools, community centres, and health centres.
USAFs can also be deployed to support training and content development. One innovative project by the Ghana Investment Fund or Electronic Communication (GIFEC) supports digital skills training for people working in the services sector (e.g., carpenters, mechanics, hairdressers, etc.). In this way, a USAF can support demand-side factors to promote broadband adoption.
Given the importance of USAFs, how many countries actually have them in place? The following table indicates which ADI countries have an existing USAF, whether it is active or inactive, or whether there is no fund at all. Out of the 58 countries covered in this report, 36 countries have an active USAF, 14 have inactive funds, and eight have no USAF at all.
| Countries | |
| USAF – inactive, no funds disbursed |
 Bangladesh, Bangladesh,
 Cambodia, Cambodia,
 China, China,
 Honduras, Honduras,
 India, India,
 Kazakhstan, Kazakhstan,
 Kenya, Kenya,
 Mali, Mali,
 Mozambique, Mozambique,
 Namibia, Namibia,
 Philippines, Philippines,
 Sierra Leone, Sierra Leone,
 Tunisia, Tunisia,
 Zimbabwe Zimbabwe
|
| USAF – active, projects funded |
 Argentina, Argentina,
 Benin, Benin,
 Bolivia, Bolivia,
 Botswana, Botswana,
 Brazil, Brazil,
 Cameroon, Cameroon,
 Colombia, Colombia,
 Cote d’Ivoire, Cote d’Ivoire,
 Costa Rica, Costa Rica,
 Dominican Republic, Dominican Republic,
 Ecuador, Ecuador,
 Egypt, Egypt,
 Ghana, Ghana,
 Indonesia, Indonesia,
 Jamaica, Jamaica,
 Malaysia, Malaysia,
 Mauritius, Mauritius,
 Mexico, Mexico,
 Morocco, Morocco,
 Nepal, Nepal,
 Nicaragua, Nicaragua,
 Nigeria, Nigeria,
 Pakistan, Pakistan,
 Peru, Peru,
 Rwanda, Rwanda,
 Senegal, Senegal,
 South Africa, South Africa,
 Sri Lanka, Sri Lanka,
 Sudan, Sudan,
 Tanzania, Tanzania,
 Thailand, Thailand,
 Turkey, Turkey,
 Uganda, Uganda,
 Venezuela, Venezuela,
 Vietnam, Vietnam,
 Zambia Zambia
|
| No USAF exists as yet |
 Burkina Faso, Burkina Faso,
 Ethiopia, Ethiopia,
 Gambia, Gambia,
 Haiti, Haiti,
 Jordan, Jordan,
 Malawi, Malawi,
 Myanmar, Myanmar,
 Yemen Yemen
|
There are several ways in which USAFs achieve their connectivity objectives. For example, Rwanda’s USAF — managed by the Rwanda Utilities Regulatory Authority and funded by an up-to-2% levy on operator turnover — supports a number of projects, including support for ICT literacy in rural areas. It also subsidises bandwidth acquisition to rural communities that do not have access, in order to ensure affordable access to internet services and wider penetration of ICT services for private and public institutions.
However, inactive funds or ineffective management of existing funds remain a stumbling block for many countries around the world. In Jordan, the government has devised a general policy for universal service but the policy has not been implemented, and a fund has not yet been established. In Kazakhstan, a defined USAF exists but the financing mechanisms to disburse funds are not yet in place. In addition to allocated state funds, there are plans to operationalise the USAF to support rural areas but for now, the funds remain unused.
Using Open Data and Open Contracting to Make USAFs More Efficient and Cost-Effective
Transparency and accountability in public services can make resource allocations more effective, lead to better engagement with citizens and the private sector, and contribute to an improvement in overall operational efficacy. The effectiveness of USAFs would, likewise, improve as a result of greater financial transparency in operations and project disbursements.
Open data — or data that is available online in a machine readable and reusable format (e.g., CSV files) and can be openly accessed and shared at no charge — can lead to new entrepreneurial opportunities, promote scientific research, increase civic engagement with government, and increase public accountability.
USAFs can adopt and employ open data practices when providing data on periodic disbursements, project information, and other metrics tracking fund performance. Another important application of open data in USAFs is around procurement processes — specifically, the use of open contracting (i.e., making public contracts available in an open data format). In the case of USAFs, providing this kind of open data can improve competition in the bidding process, allow greater transparency in the allocation of subsidies, and perhaps most importantly, make the allocation of funds more efficient and cost-effective. In fact, the benefits of open contracting apply to all government contracting, including public-private partnerships.
By employing open data practices, USAFs can become more effective in achieving their ultimate goal of universal internet access. Achieving this will, in turn, help to increase access to all open government data, helping to reduce the ‘data divide’, and enabling more people — and marginalised groups in particular — to participate in policy-making.
Unfortunately, very few countries currently engage in open data practices. A 2016 Web Foundation survey of 92 countries found that only 10% of government data sets were actually open. Research for this report found no evidence of a country applying open data practices to the operation of its USAF. Governments should apply an open data approach to USAF operations, particularly given the potential economic and efficacy benefits.
5
Achieving Access Goals Means Prioritising Broadband Policy Now
In a world where inequality remains arguably the most significant challenge of our time, lack of action on broadband affordability further prevents half the world from using needed e-government services, from accessing information about their rights, from communicating with family, friends, and customers, from sharing their history and experiences, or from engaging in building the digital future they envision. Now is the time for policymakers to commit to an ambitious ‘1 for 2’ affordability target, and back this with urgent action to expand public access, modernise broadband markets and consequently achieve the SDGs.
Affordability remains a significant — but solvable — obstacle to achieving the global target of access for all. Recent years have seen governments, businesses, and the global community at-large publicly recognise the importance of this goal; nevertheless, the level of policy effort remains inconsistent, and the pace of change far too slow to achieve connectivity for all.
It is time for policymakers to kick efforts into high gear. It is more important than ever to embrace a comprehensive approach to broadband policy — one that is grounded in an ambitious affordability target, that includes bold measures to promote competition and lowering broadband costs, and that is dedicated to investing in public access solutions. Smart policies, coupled with effective implementation and regular monitoring and evaluation progress made toward established targets can provide a path to connecting the next billions.
Paving a Path to Access for All: Policies on the Road to "1 for 2"
>> Employ Public Access Solutions to Close the Digital Divide
>> Foster Market Competition Through Smart Policy
>> Implement Innovative Uses of Spectrum through Transparent Policy
>> Take Urgent Action to Promote Infrastructure and Resource Sharing
>> Make Effective Use of Universal Service and Access Funds
>> Ensure Effective Broadband Planning Turns Into Effective Implementation
We urge national leaders, policymakers, private sector players, civil society, citizens, academia and researchers, and international organisations involved in the ICT sector, to join forces and partner to advocate, support and implement policies that aim to connect those most marginalised. By investing in public access supported by a cohesive approach to lowering broadband costs, we can collectively make significant improvements to connect many faster and in more meaningful ways. Only then can all citizens, regardless of gender, socio-economic status or geographic location, fully realise the benefits of affordable access to the internet.
6
Appendices
6.1Appendix 1: Acknowledgements
Research and analysis for the 2017 Affordability Report was led by Dhanaraj Thakur. The report was written by Dhanaraj Thakur, Erica Penfold, and Lauran Potter, with contributions from Sonia Jorge, Anne Jellema, and Dillon Mann. Nanjira Sambuli and Eleanor Sarpong provided valuable advice.
The Affordability Drivers Index research was carried out by Siaka Lougue (African Institute of Mathematical Sciences). A wide range of experts were involved in validating and reviewing the primary research conducted in 2016, and others helped to develop various case studies and best practice examples highlighted throughout the report; we thank them for their contribution and in particular Andrea Jiménez for her work on the country case studies.
We also thank the A4AI Affordability Research Working Group members for their inputs and suggestions to the early drafts. Any errors in this report remain ours alone.
Finally, we are grateful for the support of A4AI’s global sponsors — Google, SIDA and USAID — and that of the Alliance’s entire membership.
6.2Appendix 2: Methodology
As we continue to expand the scope of the index, this year we added seven more countries to those assessed by the ADI. These are Bolivia, Cambodia, Côte d’Ivoire, Honduras, Nicaragua, Sri Lanka, and Sudan, all lower-middle income countries.
6.2.1ADI Methodology
The Affordability Drivers Index (ADI) is a composite measure that summarises in a single (average) number an assessment of the drivers of internet affordability in various countries. Benefiting from the research framework established by the Web Index, the ADI covers 58 countries and focuses on two key aspects driving affordability: communications infrastructure and access.
Two types of data are used in the construction of the Index: existing data from other data providers (‘secondary data’), and new data gathered via a multi-country expert researcher survey (‘primary data’).
The primary data consists of an expert survey. The survey includes questions — scored on a scale of 0 – 10 — on issues regarding policy, regulation, and various other aspects around broadband and affordable access to the internet. The questions were specifically designed by the Alliance for Affordable Internet, the Web Foundation, and its advisers. These primary data, based on and aligned with the A4AI Policy and Regulatory Good Practices, attempt to assess the extent to which countries have achieved a policy and regulatory environment that reflects the best practice outcomes. Survey questions were scored based on predetermined criteria by country experts. Three country experts were asked to provide evidence and justification that supports each score. The scores were checked and verified by a number of peer and regional reviewers.
This year we conducted a new round of policy surveys on the 58 countries covered by the ADI. The surveys were conducted in between June and September 2016 by regional policy experts, and included a peer-review process to improve the accuracy of the results. The surveys consist of what are referred to as the primary indicators making up the ADI, which are linked to A4AI’s good practices and policies to lower the overall cost structure for broadband. The 2016 surveys updated the results of our 2014 surveys and assess government policies during that two year period. In addition, we draw on a range of secondary indicators to derive the sub-indices described above as well as the final composite index.
The factors that the ADI covers are grouped into two sub-indices — infrastructure and access:
- The infrastructure sub-index measures the current extent of infrastructure deployment and operations, alongside the policy and regulatory frameworks in place to incentivise and enable cost-effective investment in future infrastructure expansion. Variables included in this sub-index include, for example, the amount of international bandwidth available in a particular country, and an assessment of a nation’s spectrum policy.
- The access sub-index measures current broadband adoption rates and the policy and regulatory frameworks in place to encourage growth and ensure provision of affordable and equitable access.This sub-index includes variables such as current internet penetration rates and an assessment of the effectiveness of a country’s Universal Service Funds.
6.2.2Data Sources and Data Providers
We employed data from several large international databases to measure or proxy the dimensions under study. Before an indicator is included in the Index, it needs to fulfil five basic criteria:
- Data providers have to be credible and reliable organisations, which are likely to continue to produce these data (i.e., it is not a one-off dataset publication).
- Data releases should be regular, with new data released at least every three years.
- There should be at least two data years for each indicator, so that a basic statistical inference could be made.
- The latest data year should be no older than three years back from publication year.
- The data source should cover at least two-thirds of the sample of countries, so that possible bias — introduced by having a large number of indicators from one source that systematically does not cover one-third or more of the countries — is reduced.
All the indicators included in the ADI are listed below, where they are grouped by sub-index and type (primary sources or secondary sources). There are two distinct types of indicators: primary and secondary. The primary indicators (codes A1-A13) are collected via the policy surveys described earlier. The secondary sources included data collected by the ITU, GSMA Intelligence, and the World Bank.
The indicators used in the ADI represent a comprehensive set of factors that influence broadband affordability. However, this is not a complete list as there may be other important factors which cannot be included because they do not meet the criteria above. In such cases, we conduct supplementary analyses to the index as we have done in past by looking at income and gender equality.
| Type (Code) | Infrastructure Sub-index Indicators |
| Primary (A12) | USFs used to subsidise access for underserved and underprivileged populations |
| Primary (A4) | ICT regulatory decisions informed by adequate evidence |
| Primary (A13) | Specific policies to promote free or low-cost access |
| Primary (A11) | To what extent have Universal Access/Service Funds (USF) prioritised infrastructure investments that will reduce costs and increase access for underserved communities and market segments? |
| Primary (A2) | To what extent does the gov’t ICT regulator perform its functions according to published and transparent rules, with the ICT regulatory decisions influenced by public consultations? |
| Secondary (WI) | Market Concentration - Herfindahl Index (HHI) |
| Secondary (ITU_K) | Existence of National Broadband Plan |
| Secondary (ITU_B) | Fixed broadband subscribers (per 100 people) |
| Secondary (WI_B) | Unique mobile Internet subscribers (per 100 people) |
| Secondary (WI_C) | Mobile broadband connections (% of all connections) |
| Secondary (WEF_B) | Internet access in schools |
| Secondary (ITU_EYE) | Cluster of ITU indicators (bundled) |
| Secondary (ITU_N) | Percentage of individuals using the Internet |
| Primary (A1) | Flexible, technology & service neutral ICT licensing frameworks |
| Primary (A8) | Specific guidelines for public infrastructure funding & telecoms subsidies |
| Primary (A9) | Time bound gov’t plan to make available broadband spectrum for high-speed data services |
| Primary (A10) | Transparent, competitive and fair process for increasing spectrum availability |
| Primary (A3) | To what extent does the regulator and/or the competition commission enforce the country's ICT licensing requirements and regulations? |
| Primary (A6) | National policies in place facilitating efficient access to public rights of way & tower zoning permissions |
| Primary (A7) | To what extent does the government facilitate resource sharing across telecommunications operators? |
| Secondary (ITU_G) | Percentage of population covered by mobile cellular network |
| Secondary (ITU_A) | International bandwidth per Internet user (bits/s) |
| Secondary (ITU_O) | Fixed broadband speed (Mbps) |
| Secondary (ITU_L) | Investment per telecom subscriber (average over 3 years) |
| Secondary (WB_A) | Secure Internet servers (per 1 million people) |
| Secondary (IEAA) | Electrification Rate |
| Secondary (PCH) | Existence of Internet Exchange Points (IXPs) |
6.2.3Index Computation
There are several steps in the process of constructing a composite index. Some of those involve deciding which statistical method to use in the normalisation and aggregation processes. In arriving at that decision, we took into account several factors, including the purpose of the Index, the number of dimensions we were aggregating, and the ease of disseminating and communicating it in an understandable, replicable, and transparent way.
The following seven steps summarise the computation process of the Affordability Drivers Index:
- Take the data for each indicator from the data source for the 88 countries covered by the Web Index for the 2007-2015 time period. Impute missing data for every secondary indicator for the sample of 88 countries over the period 2007-2015. Some indicators were not imputed, as it was not logical to do so. None of the primary data indicators were imputed. Hence, the 2017 Affordability Drivers Index is very different from the 2007-2015 Indexes that may be computed using secondary data only. Broadly, the imputation of missing data was done using two methods, in addition to extrapolation: country-mean substitution if the missing number is in the middle year (e.g., have data for 2009 and 2011, but not for 2010), or taking arithmetic average growth rates on a year-by-year basis. For the indicators that did not cover a particular country in any of the years, no imputation was done for that country/indicator.
- Normalise the full (imputed) dataset using z-scores (z=(x-mean)/standard deviation), making sure that for all indicators, a high value is ‘good’ and a low value is ‘bad’.
- Where applicable, cluster some of the variables (as per the scheme in the tree diagram), taking the average of the clustered indicators post-normalisation. For the clustered indicators, this clustered value is the one to be used in the computation of the Index components.
- Compute the two sub-index scores using arithmetic means, using the clustered values where relevant.
- Compute the min-max values for each z-score value of the sub-indices, as this is what will be shown in the visualisation tool and other publications containing the sub-index values (generally, it is easier to understand a min-max number in the range of 0 – 100 rather than a standard deviation-based number). The formula for this is: [(x –min)/(max – min)]*100.
- Compute overall composite scores by averaging the sub-Indexes (at z-score level).
- Compute the min-max values (on a scale of 0-100) for each z-score value of the overall composite scores, as this is what will be shown in the visualisation tool and other publications containing the composite scores.
6.3Appendix 3: ADI Results by Income Group
See the World Bank’s country classification by income: https://datahelpdesk.worldbank.org/knowledgebase/articles/906519
| Country | Access Sub-Index Score | Infrastructure Sub-Index Score | ADI Score | ADI Rank |
|---|---|---|---|---|
 Colombia Colombia |
85.28 | 58.15 | 72.87 | 1 |
 Mexico Mexico |
87.23 | 53.43 | 71.47 | 2 |
 Peru Peru |
80.54 | 58.89 | 70.84 | 3 |
 Malaysia Malaysia |
85.25 | 49.86 | 68.65 | 4 |
 Costa Rica Costa Rica |
88.36 | 44.3 | 67.4 | 5 |
 Ecuador Ecuador |
79.48 | 46.1 | 63.81 | 6 |
 Argentina Argentina |
76.26 | 48.95 | 63.62 | 7 |
 Mauritius Mauritius |
78.06 | 43.39 | 61.7 | 8 |
 Brazil Brazil |
68.57 | 51.05 | 60.78 | 10 |
 Jamaica Jamaica |
74.84 | 37.12 | 56.88 | 12 |
 Dominican Rep. Dominican Rep. |
68.8 | 40.42 | 55.49 | 14 |
 Botswana Botswana |
67.06 | 41.91 | 55.37 | 15 |
 South Africa South Africa |
61 | 39.78 | 51.2 | 22 |
 China China |
63.56 | 36.13 | 50.65 | 25 |
 Jordan Jordan |
62.57 | 34.29 | 49.22 | 27 |
 Namibia Namibia |
61.29 | 33.66 | 48.24 | 31 |
 Uganda Uganda |
58.57 | 35.77 | 47.93 | 32 |
 Tunisia Tunisia |
56.58 | 36.37 | 47.23 | 34 |
 Venezuela (Bolivarian Republic Of) Venezuela (Bolivarian Republic Of) |
55.35 | 27.05 | 41.86 | 40 |
 Kazakhstan Kazakhstan |
58.86 | 21.97 | 41.07 | 43 |
| Country | Access Sub-Index Score | Infrastructure Sub-Index Score | ADI Score | ADI Rank |
|---|---|---|---|---|
 Turkey Turkey |
71.73 | 48.58 | 61.13 | 9 |
 Morocco Morocco |
72.94 | 40.73 | 57.75 | 11 |
 Nigeria Nigeria |
67.66 | 43.7 | 56.58 | 13 |
 Viet Nam Viet Nam |
69.75 | 35.65 | 53.55 | 16 |
 Côte d'Ivoire Côte d'Ivoire |
64.97 | 39.84 | 53.25 | 18 |
 Bolivia Bolivia |
63.74 | 40.25 | 52.83 | 19 |
 Honduras Honduras |
59.44 | 42.19 | 51.63 | 20 |
 Indonesia Indonesia |
61.34 | 38.89 | 50.92 | 23 |
 Sri Lanka Sri Lanka |
55.17 | 45.03 | 50.91 | 24 |
 Ghana Ghana |
60.68 | 37.75 | 50.01 | 26 |
 Pakistan Pakistan |
56.54 | 40.03 | 49.07 | 28 |
 Kenya Kenya |
61.55 | 34.53 | 48.82 | 30 |
 Philippines Philippines |
57.09 | 36.46 | 47.53 | 33 |
 India India |
55.36 | 37.46 | 47.16 | 35 |
 Egypt Egypt |
52.78 | 35.93 | 45.07 | 36 |
 Zambia Zambia |
57.06 | 31.41 | 44.95 | 37 |
 Myanmar Myanmar |
40.61 | 40.83 | 41.37 | 42 |
 Bangladesh Bangladesh |
45.69 | 31.88 | 39.41 | 46 |
 Cambodia Cambodia |
42.17 | 32.72 | 38.05 | 48 |
 Nicaragua Nicaragua |
48.17 | 24.86 | 37.1 | 49 |
 Cameroon Cameroon |
41.03 | 25.33 | 33.71 | 52 |
 Sudan Sudan |
45.21 | 18.08 | 32.16 | 53 |
 Yemen Yemen |
0 | 0 | 0 | 58 |
| Country | Access Sub-Index Score | Infrastructure Sub-Index Score | ADI Score | ADI Rank |
|---|---|---|---|---|
 Thailand Thailand |
67.79 | 37.32 | 53.4 | 17 |
 Rwanda Rwanda |
66.09 | 35.23 | 51.48 | 21 |
 Benin Benin |
56.87 | 39.47 | 48.95 | 29 |
 Gambia Gambia |
53.07 | 35.38 | 44.94 | 38 |
 United Republic Of Tanzania United Republic Of Tanzania |
53.43 | 32.64 | 43.73 | 39 |
 Nepal Nepal |
51.8 | 30.35 | 41.74 | 41 |
 Mali Mali |
49.25 | 31.07 | 40.81 | 44 |
 Mozambique Mozambique |
47.47 | 31.58 | 40.16 | 45 |
 Senegal Senegal |
49.63 | 27.26 | 39.07 | 47 |
 Zimbabwe Zimbabwe |
47.26 | 21.56 | 34.97 | 50 |
 Malawi Malawi |
40.07 | 28.1 | 34.64 | 51 |
 Burkina Faso Burkina Faso |
34.76 | 23.66 | 29.68 | 54 |
 Ethiopia Ethiopia |
41.39 | 2.34 | 22.22 | 55 |
 Sierra Leone Sierra Leone |
29.7 | 13.13 | 21.76 | 56 |
 Haiti Haiti |
21.82 | 5.97 | 14.12 | 57 |
6.4Appendix 4: Broadband Policies, by country
6.5Appendix 5: Additional Results
Figure 6. Relationship between ADI score and price of a 500MB prepaid mobile plan as a % of GNI per capita (2015)
| Country | Price of a1GB mobile prepaid plan as a% of average monthly income, 2015 | Market penetration (mobile broadband unique subscribers as a % of population), 2015 | Country Income Classification |
|---|---|---|---|
 Kazakhstan Kazakhstan |
0.56% | 21.12% | Upper-middle income |
 China China |
0.70% | 43.25% | Upper-middle income |
 Sudan Sudan |
0.99% | 17.17% | Lower-middle income |
 Mauritius Mauritius |
1.12% | 26.93% | Upper-middle income |
 Turkey Turkey |
1.18% | 15.78% | Upper-middle income |
 Malaysia Malaysia |
1.19% | 46.00% | Upper-middle income |
 Egypt, Arab Rep. Egypt, Arab Rep. |
1.19% | 18.76% | Lower-middle income |
 Jamaica Jamaica |
1.26% | 21.23% | Upper-middle income |
 Colombia Colombia |
1.45% | 24.00% | Upper-middle income |
 Jordan Jordan |
1.45% | 30.89% | Upper-middle income |
 Argentina Argentina |
1.51% | 35.59% | Upper-middle income |
 Indonesia Indonesia |
1.53% | 19.72% | Lower-middle income |
 Tunisia Tunisia |
1.56% | 31.53% | Lower-middle income |
 Brazil Brazil |
1.97% | 48.85% | Upper-middle income |
 Costa Rica Costa Rica |
2.02% | 49.89% | Upper-middle income |
 Mexico Mexico |
2.03% | 33.35% | Upper-middle income |
 Morocco Morocco |
2.05% | 19.74% | Lower-middle income |
 Pakistan Pakistan |
2.07% | 8.04% | Lower-middle income |
 Thailand Thailand |
2.27% | 66.49% | Upper-middle income |
 South Africa South Africa |
2.48% | 28.02% | Upper-middle income |
 Namibia Namibia |
2.69% | 16.22% | Upper-middle income |
 Vietnam Vietnam |
2.73% | 23.00% | Lower-middle income |
 Bolivia Bolivia |
2.89% | 18.91% | Lower-middle income |
 Cambodia Cambodia |
3.36% | 31.03% | Lower-middle income |
 Venezuela, RB Venezuela, RB |
3.51% | 24.35% | Upper-middle income |
 India India |
3.55% | 6.66% | Lower-middle income |
 Bangladesh Bangladesh |
3.63% | 8.33% | Lower-middle income |
 Peru Peru |
3.80% | 27.21% | Upper-middle income |
 Philippines Philippines |
3.80% | 26.27% | Lower-middle income |
 Ghana Ghana |
3.89% | 15.84% | Lower-middle income |
 Dominican Republic Dominican Republic |
3.97% | 17.56% | Upper-middle income |
 Botswana Botswana |
5.74% | 21.02% | Upper-middle income |
 Myanmar Myanmar |
5.90% | 14.94% | Lower-middle income |
 Zimbabwe Zimbabwe |
6.03% | 15.36% | Low income |
 Ecuador Ecuador |
6.58% | 14.38% | Upper-middle income |
 Nigeria Nigeria |
7.63% | 11.93% | Lower-middle income |
 Haiti Haiti |
7.94% | 11.26% | Low income |
 Honduras Honduras |
8.56% | 21.66% | Lower-middle income |
 Tanzania Tanzania |
8.74% | 14.17% | Low income |
 Nepal Nepal |
9.14% | 9.64% | Low income |
 Nicaragua Nicaragua |
9.45% | 28.15% | Lower-middle income |
 Kenya Kenya |
9.72% | 10.86% | Lower-middle income |
 Senegal Senegal |
10.20% | 10.10% | Low income |
 Mozambique Mozambique |
11.94% | 12.28% | Low income |
 Cameroon Cameroon |
12.27% | 2.98% | Lower-middle income |
 Yemen Yemen |
12.48% | 4.21% | Lower-middle income |
 Gambia, The Gambia, The |
14.12% | 9.36% | Low income |
 Côte d'Ivoire Côte d'Ivoire |
14.47% | 16.38% | Lower-middle income |
 Zambia Zambia |
14.94% | 8.98% | Lower-middle income |
 Burkina Faso Burkina Faso |
15.45% | 3.76% | Low income |
 Benin Benin |
16.60% | 4.09% | Low income |
 Mali Mali |
19.37% | 11.17% | Low income |
 Ethiopia Ethiopia |
19.63% | 12.19% | Low income |
 Rwanda Rwanda |
20.16% | 15.02% | Low income |
 Uganda Uganda |
27.71% | 7.77% | Low income |
 Malawi Malawi |
45.53% | 3.02% | Low income |
 Sierra Leone Sierra Leone |
51.89% | 11.08% | Low income |

 Botswana